Price-Weighted Nikkei 225: Tracking Japan's Economic Journey
"The numbers don't just tell a story of profit and loss; they tell the story of a nation's resilience through decades of upheaval."
The Nikkei 225 is often viewed as a chaotic rollercoaster, but it is actually a precision-engineered barometer of Japan's industrial might. To understand the Japanese economy, one must understand why this specific index moves the way it does.
* Calculation Mechanics: The index is price-weighted, meaning specific high-priced stocks can disproportionately influence its movement. * Historical Volatility: From post-bubble crashes to natural disasters, the index has survived extreme fluctuations. * Institutional Influence: Massive shifts in ownership, including central bank involvement, have fundamentally altered market dynamics.

What is the Nike 225 and How is it Calculated?
A trader sits in a quiet office in Minato City, watching a digital screen flicker as numbers dance across the display. The rapid shifts in value happen in the blink of an eye, reflecting global shifts in real-time.
The Nikkei 225 serves as the primary benchmark for the Japanese equity market, representing a cross-section of blue-chip companies. Unlike market-cap-weighted indices used in the United States, which weight companies by their total size, the Nikkei 225 is a price-weighted index.
This means that the absolute price of a company's stock, rather than its total market value, plays a significant role in its impact on the index.
Because of this structure, a single high-priced stock can move the entire index significantly. To keep pace with modern high-frequency trading, the index is updated every 5 seconds during active trading sessions.
This constant stream of data allows investors to react to global news almost instantaneously.
But why do these sudden shifts often feel so much more violent than other markets?
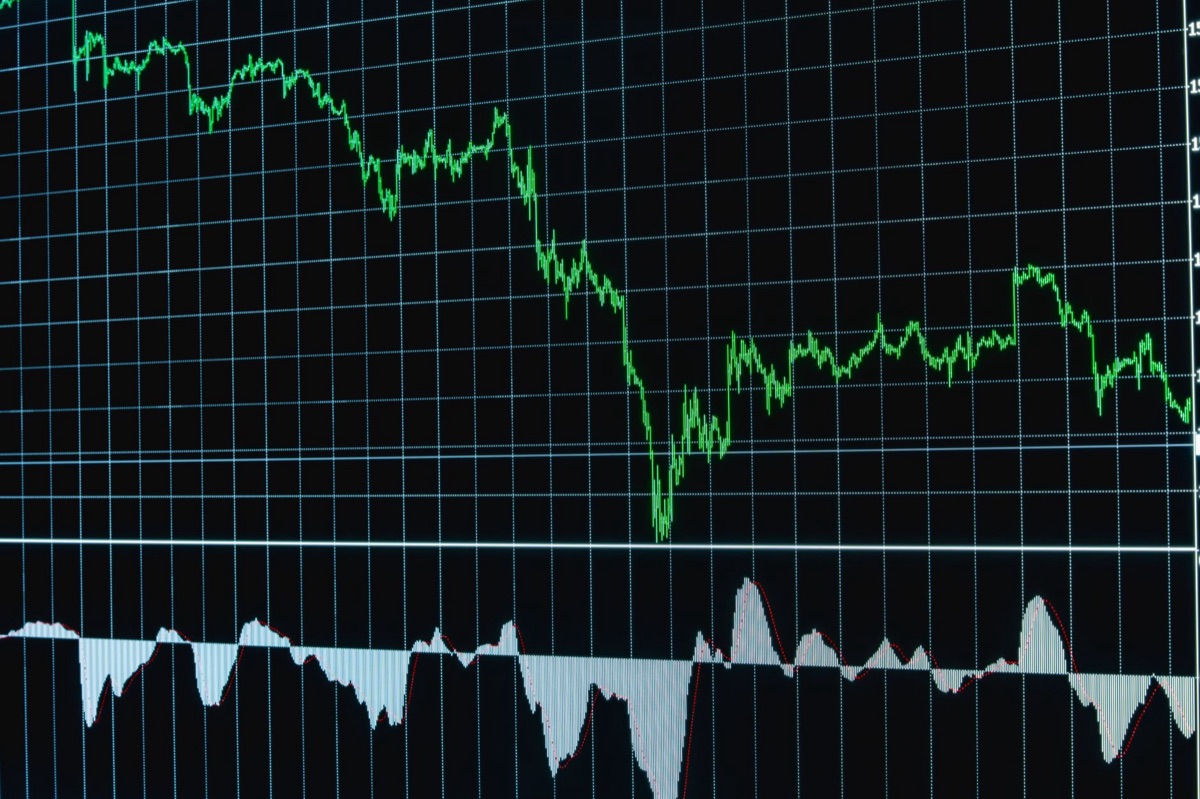
Navigating Historical Volatility: Why the Crashes Felt So Deep
A heavy silence fell over the Tokyo Stock Exchange in late 2008 as investors watched their portfolios evaporate. The tension in the room was thick, mirroring the uncertainty felt across the entire nation.
The history of the Nikkei 225 is marked by periods of extreme turbulence. Following the massive asset bubble of the late 1980s, the index entered a long period of decline.
On 28 October 2008, the index hit a post-bubble intraday low of 6,994.90, which represented a staggering 82% loss from its peak nearly 19 years earlier.
Natural disasters have also left deep scars on the index's performance. On 15 March 2011, just two working days after a massive earthquake struck northeastern Japan, the index dropped over 10% to finish at 8,605.15, a loss of 1,015 points.
This volatility was not an isolated incident; the index fell over 17% throughout 2011, finishing the year at 8,455.35. This was its lowest year-end closing value in nearly thirty years, falling below its 1982 year-end close of 8,016.70.
These massive swings make the index unpredictable, yet they often point toward a deeper shift in who actually controls the market.
Structural Shifts and Institutional Influence: Who Really Pulls the Strings?
An empty boardroom at a major bank stands as a testament to the changing tides of ownership. The hands that hold the power in the market have shifted from individual investors to massive institutions.
The landscape of Japanese finance has been fundamentally reshaped by institutional actors. A significant shift occurred when the Bank of Japan (BOJ) began intervening heavily in the market.
From the start of 2013 through the end of 2017, the BOJ owned approximately 75% of all Japanese Exchange Traded Funds (ETFs).
This level of institutional ownership creates a unique market environment where central bank policy can act as a massive stabilizer or a source of unprecedented liquidity.
These structural shifts mean that the index is not just a reflection of corporate health, but also a reflection of monetary policy and the strategic decisions of the nation's central bank.
However, when the central bank moves, the rest of the market often feels the shockwaves.

Indicators of Market Stress: When Does the Index Signal Trouble?
The sound of a sudden, sharp sell-off is often quiet, manifested only by a rapid descent of red numbers on a screen. In these moments, the relationship between sentiment and math becomes dangerously thin.
Market stress often manifests through sudden, sharp plunges that test investor psychology. Historically, the index has shown a tendency to plunge by almost 10% during periods of high uncertainty before attempting a rebound.
This makes it one of the most volatile stock market indices among developed markets.
When these sharp drops occur, they often signal a disconnect between corporate reality and investor sentiment.
Because the index is price-weighted, a sudden shift in the sentiment regarding a few high-priced "bellwether" stocks can trigger a massive, rapid decline across the entire index, often before the broader economy has even felt the impact.
But is the index always a reliable messenger of the economy?
The Index in Context: Global vs. Domestic Factors
A traveler looking out over the skyline of Osaka might see a city of growth, but a global investor sees a complex web of interconnected markets. The Japanese market does not exist in a vacuum; it is a player on a global stage.
While global trends certainly impact the Nikkei 225, domestic factors often drive its most violent movements. The index acts as a mirror to Japan's specific economic challenges, such as demographic shifts and domestic monetary policy.
The ability of the index to absorb severe domestic pressures—like the 2011 earthquake or the post-bubble era—demonstrably illustrates its resilience.
While global markets might fluctuate based on American interest rates or Chinese growth, the Nikkei 225 remains uniquely sensitive to the internal mechanics of the Japanese economy and the specific weightings of its constituent companies.
When I first started tracking these movements, I noticed that the index often reacted to news hours before the actual economic data was even released. It felt like watching a shadow move before the person does.
It is important to note that the index is a tool of measurement, not a guarantee of prosperity. It can be skewed by specific sectors and does not account for the total wealth of the Japanese population or the health of small-scale businesses.
| Feature | Nikkei 225 Characteristics |
|---|---|
| Weighting Method | Price-weighted |
| Update Frequency | Every 5 seconds during trading |
| Primary Driver | High-priced blue-chip stocks |
| Volatility Level | High (among developed markets) |







Comments 0